Choosing the right listing price is key to maximizing the income that an owner can generate from the property. Setting the price too high will cause the property to sit vacant too long. Setting the price too low will get in rented faster but will leave some money on the table as the marketplace may have been willing to pay more. The key is to strategically set the list price based on a Rental Analysis which is a report of what other comparable homes have rented for. Here’s some factors to consider:
SETTING THE LISTING PRICE
Rental Analysis: A property manager can help with this task as they will have access to the Multiple Listing Service which is a database of information accessible to real estate brokers. This database tracks the listings (Active, Pending & Leased) and the information can be prepared into a Rental Analysis. Criteria: When pulling the data from the Multiple Listing Service a property manager must choose which factors will be used. Here are some factors that are considered…
Basic Factors: The basic factors to consider for any search is the Property Type (House, Condo, Townhome, etc.), the Bedroom & Bathroom Count, the Square Footage (we want to compare properties that are approximately 20% smaller and larger which are deemed to be comparable), the City (pulling other properties that are in the same city) and Timeframe (we only want to compare properties that have been leased within the last 12 months).
Additional Factors: Most of the time the above basic factors will be enough to pull comparable properties. However, depending on the property, additional factors may need to be considered to truly narrow down the list to properties that are comparable. Here are some additional items to consider…
Garages: One must consider the number of garage spaces and whether the garage is attached vs. detached.
Year Built: Attention must be paid to the age of the home. Homes that are newer (built in the 2000’s or newer) may command slightly higher rental rates.
Attached vs. Detached: For Single Family Residences there can be properties that are attached. These usually rent for slightly lower numbers then the exact same comparable if it’s detached.
Senior Community: Attention must be paid to make sure that the list of comparable is not including senior communities. Alternatively, if the property being rented out is in a senior community, then it’s best to only pull comps within that community or other senior communities.
Proximity: Depending on the city where the property is located there may not be enough comparables. If this happens then it’s best to pull one or two additional cities that may be next in proximity.
HVAC: While a property must have a heat source it is not required to have air conditioning. Though it doesn’t come often, if the property doesn’t have central air then this must be taken into account as other comparables may be renting at slightly higher numbers if they offer central air.
Average Days on Market: This is a key statistic that will track the average days from the moment a property is on the market up until the moment there’s a signed lease and it’s a key metric so an owner can plan for expected vacancy costs. This will vary depending on the criteria factors as listed above but in Orange County one can expect the average days on market to be between 21 – 28 days. It is important to note that this benchmark measures up to the point where the lease is signed, not the move-in date of a resident as every situation is different with some residents looking to take possession as soon as possible and others may push back their move-in date by a week or so.
Price Range: When looking at a rental analysis the price for a property is not set in stone but it will be a range between the flooring and ceiling in pricing. Most of the closed leases (about 80%) will be between the floor and ceiling in pricing but for the most part there will always be outliers both below and above the range. The range in pricing tends to follow a rule of thumb based on the price of the rental. The following are some rules of thumb…
$2,000’s: If a property is renting in the $2,000’s range then the range between the floor and ceiling in pricing is approximately $200.
$3,000’s: If a property is renting in the $3,000’s range then the range between the floor and ceiling in pricing is approximately $300.
$4,000 - $6,000’s: If a property is renting in this range then the range between the floor and ceiling in pricing is approximately $500.
$6,000+: The range in pricing can be up to $1,000 between the floor and ceiling in pricing.
MAKING PRICE ADJUSTEMENTS
Once the property is on the market the two indicators of whether the right price was set will be measured in showings and applications. Ideally, if the right price was set then it will generate multiple showings as well as applications. However, if the marketplace is not seeing value in the price that has been set then it will result in few if any showings and few if any applications. A common rule of thumb is that a property is on the market for a total of 10 days and there are 0 showings or if there’s a total of 10 showings and there’s a total of 0 applications it means that the rental price is too high, and an adjustment to the price needs to be made. This may be a hard decision to make but it is crucial as the cost of vacancy needs to be taken into consideration.
Cost of Vacancy: A dollar today is better than a dollar tomorrow. A resident moving in today is better than a resident moving in a week from now. For this example, we will use a hypothetical property where the floor in pricing is set at $3,400 and the ceiling in pricing is set at $3,700. Let’s assume that an owner has decided to list the property at $3,800 to see if the marketplace is willing to pay that rental price. The following is an example of how the vacancy factor needs to be taken into consideration when having to adjust the list price if there are no showings and/or applications…
Chart #1:
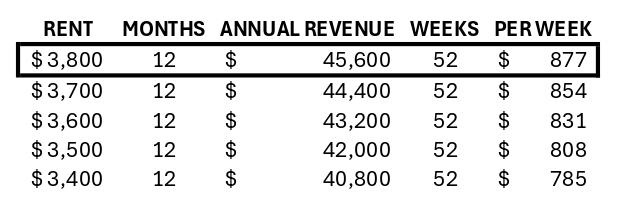
This chart shows the income per week under the assumption that its rented out for the rental amount under the first column. This weekly rental amount is what we use to calculate the vacancy factor under Chart #2.
Chart #2: 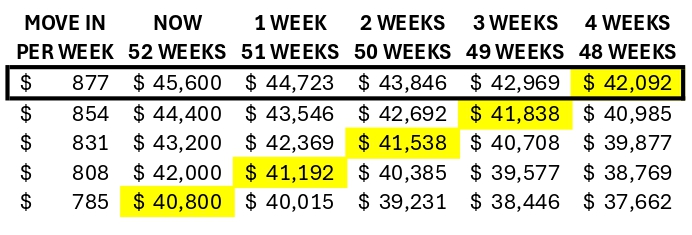
This chart starts out with the weekly income and shows what the revenue would be if the property was rented today for a total of 52 Weeks in revenue or one week from now for a total of 51 Weeks in revenue or two weeks from now for a total of 50 Weeks in revenue and so on and so forth.
Analysis: The yellow highlighted sections showcase the cost of vacancy. Though the amounts being highlighted are not the exact the same, they are close. As an example, collecting $3,700 three weeks from now is almost the same as collecting $3,500 starting one week from now. This is the loss of having a vacancy and that’s why it is important to adjust the price down to further increase interest in the home.
Making Adjustments: An owner can have an 80% degree of certainty that a property will rent within the range between the floor and ceiling in pricing as the marketplace has already shown that it is willing to pay that price. If the other two factors on Keys to Leasing Success (Condition & Marketing) are in place then the only other possible factor is price and a price adjustments should be made. When a price adjustment is made it will trigger the listing to show up again on perspective renters search giving the property another wave of interested parties and promote both more showings and applications.
CONCLUSION
A property manager can assist with preparing a rental analysis, making a recommendation as to what the list price should be and advising when it is necessary to make a price adjustment.